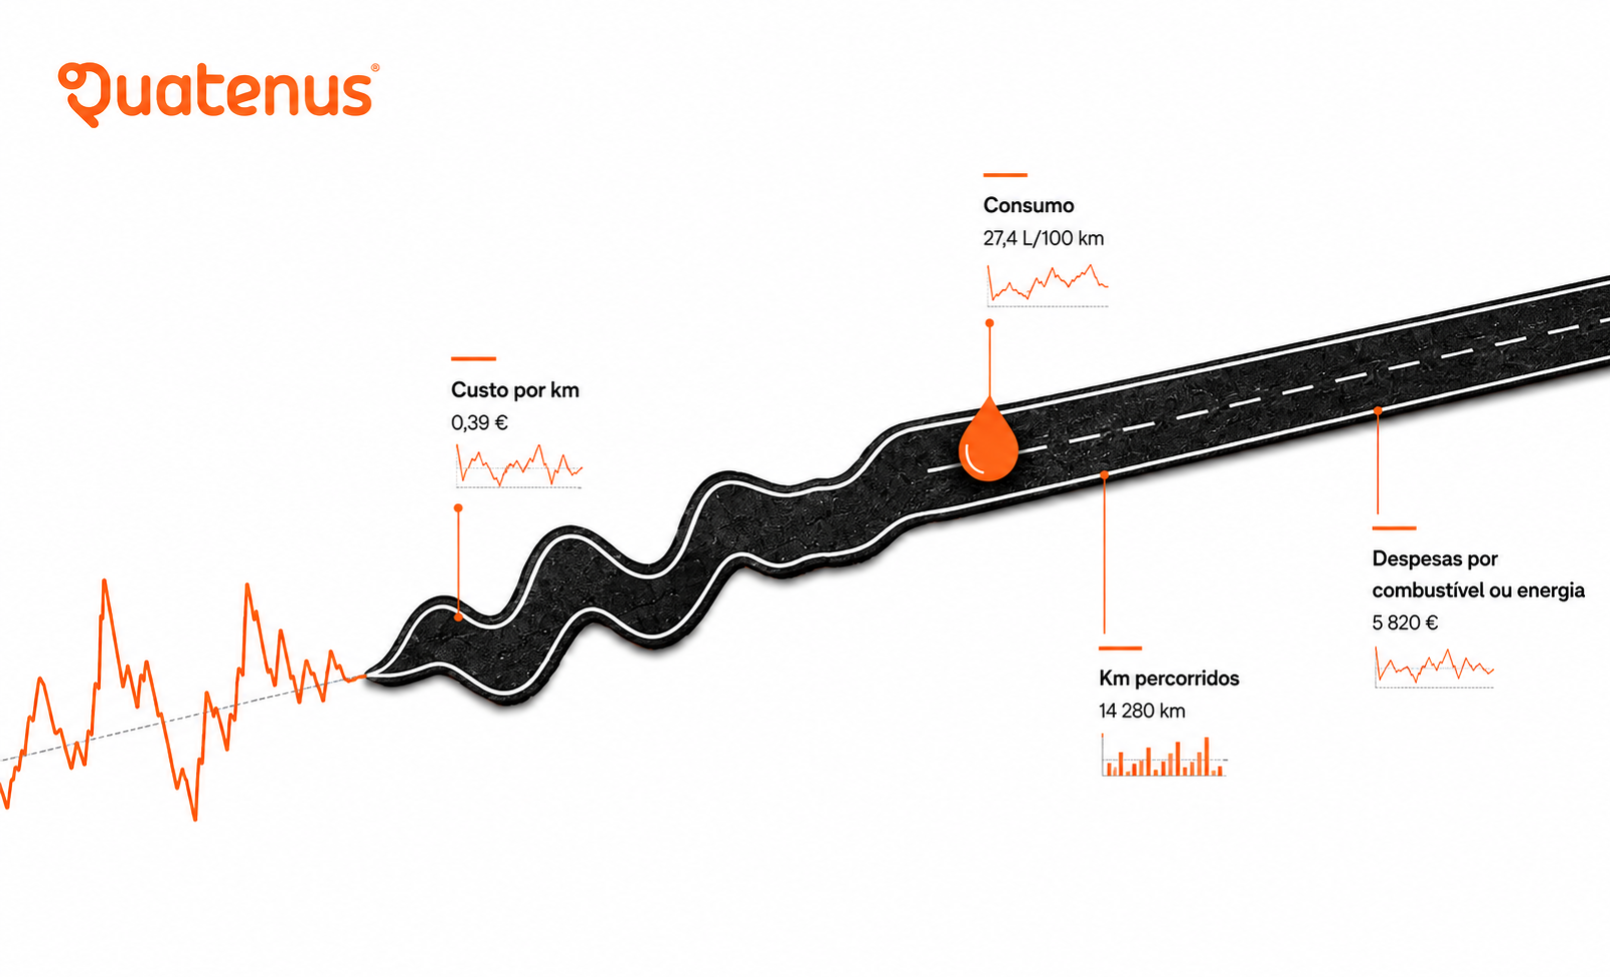
When diesel prices become unpredictable, fleet management becomes more exposed. The company still needs to keep vehicles on the road, complete services, visit customers, deliver goods, support teams and maintain daily operations. The issue is that every kilometre can start to weigh more heavily on the budget.
In a period of instability, looking only at the fuel invoice is no longer enough. Managers need to understand how much it costs to operate, which vehicles concentrate more expenses, how consumption is evolving and whether the increase in cost comes only from the market or also from the way the fleet is being used.
This is where cost per kilometre becomes important. More than a financial figure, it is a management indicator that connects fuel, distance travelled, consumption, tolls and the global cost of the operation.
Fuel market instability creates pressure that no company can fully control. Crude oil prices, refined fuel availability, refining margins, inventories and international supply flows can change the final cost without depending on the company’s operation.
But the monthly invoice does not show everything. A higher expense may result from the price per litre, but it may also be linked to more kilometres travelled, higher consumption, less efficient routes, more time on the road, tolls, delayed maintenance or uneven vehicle usage.
This is why the most useful question for a fleet manager is not only “how much did we spend on fuel?”. The more useful question is “how much did each kilometre of the operation cost and what explains that change?”.
Quatenus helps managers track this reality through reports that give more context to fleet expenses.
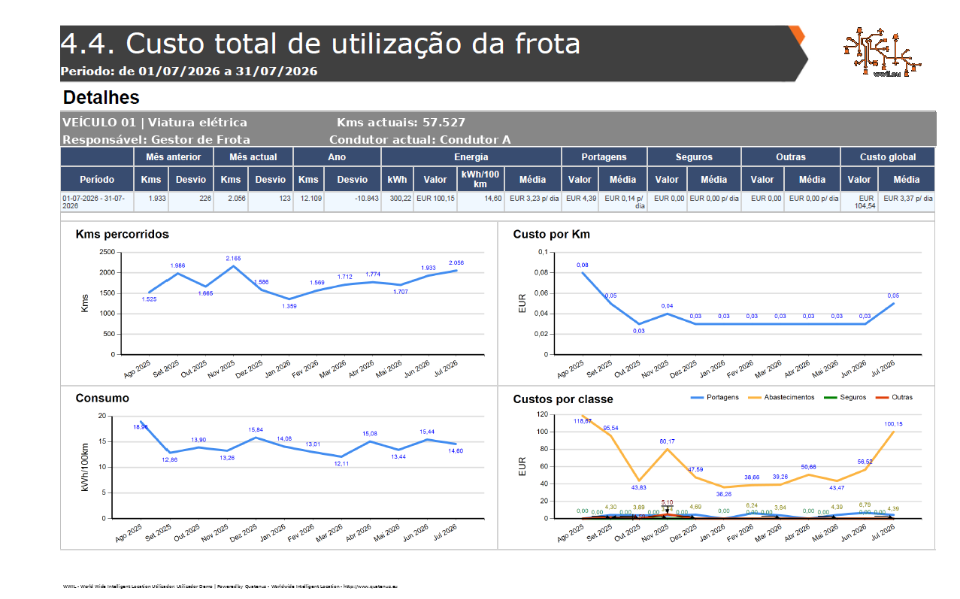
The 4.4 Total fleet usage cost report deepens the analysis. Instead of looking only at refuelling, managers can connect distance travelled, consumption, amount of fuel or energy, tolls, averages, deviations and global cost.
The solution is not to predict diesel prices. It is to give managers a clearer view of what can still be monitored within the operation.
Cost per kilometre turns scattered data into a comparable view. Instead of analysing only total amounts, managers can understand the relationship between what a vehicle consumed, the kilometres it travelled and the total cost associated with its use.
This helps compare periods, vehicles and operational behaviours. One vehicle may have a lower monthly expense because it travelled less. Another may have a higher expense but show a more stable cost per kilometre. Without this indicator, these differences can go unnoticed.
The logic is simple: when the market changes, the operation needs a metric that helps separate external price pressure from internal performance. Cost per kilometre provides that starting point.
In a context of unstable fuel prices, reports should be used as part of a management routine. The analysis does not need to start with a complex review. It can begin with practical questions:
What was the cost per kilometre of each vehicle this month?
Did consumption increase compared with the previous month?
Did the expense rise because the vehicle travelled more or because it consumed more?
Are refuelling or charging events concentrated on specific days?
What is the weight of tolls and other costs in the global cost of the operation?
Are there vehicles with deviations that need validation?
The expense report shows when the cost occurs. The total usage cost report shows the impact of that expense on the real use of the fleet. Together, they help managers move from a late financial reading to a more continuous operational view.
No report removes fuel instability. But data based fleet management reduces dependence on isolated perceptions and reactive decisions.
By tracking cost per kilometre, managers gain a more concrete view of fleet efficiency. They can identify patterns, compare vehicles, monitor consumption, understand deviations and discuss costs with more context.
This is especially important when diesel prices rise or fluctuate. In these periods, every operational decision carries more weight: a poorly planned route, an inefficient vehicle, unbalanced usage or abnormal consumption can directly affect the budget.
The advantage lies in having information that supports earlier action.
A useful routine can begin with a weekly or monthly review. First, the manager checks expenses by fuel or energy type. Then, refuelling and charging events are validated in the calendar. Next, distance travelled, consumption, cost per kilometre and global cost are compared by vehicle.
This sequence helps identify whether the issue is linked to the market, usage, consumption, routes, tolls or a combination of several factors. The goal is not to find someone to blame. It is to create a fairer and more useful view for decision making.
FAQ
Because it connects vehicle expense with real usage. Instead of looking only at fuel spend, managers can understand how much each kilometre cost and compare vehicles, periods and consumption patterns with more context.
No. Diesel price can have a significant impact, but the final cost also depends on kilometres travelled, consumption, routes, tolls, maintenance and how vehicles are used. This is why cost per kilometre helps separate external pressure from operational factors.
Report 4.3 allows managers to view refuelling and charging events in a calendar format, while summarising expenses by period, fuel or energy type, vehicle and user. This helps identify when expenses occur and how they are distributed across the fleet.
Report 4.4 connects distance travelled, deviations, fuel or energy, consumption, tolls, averages and global cost. With this data, managers can assess whether a vehicle costs more because it travels more, consumes more or concentrates other usage related costs.
They should not be seen as an automatic guarantee of cost reduction. Their value lies in giving managers visibility to identify patterns, monitor deviations and make better informed decisions. Waste reduction depends on analysis, decisions and actions applied to the operation.
Related